Steve Thomas - IT Consultant

It’s difficult to create budget plans, data entry records, and financial information without a productivity tool like Microsoft Excel. Over the years, it’s been a staple in most offices because of its many useful functions, which aid in making business decisions a lot easier. And with a new feature, Excel has become even handier.

Previous Excel upgrades include the addition of dynamic arrays and array formulas, a feature that enabled single formulas to return an array of values. Another upgrade was the Stocks and Geography function, which lets users add stock and geography data into a spreadsheet with the help of the search engine Bing. These are both useful, but Microsoft decided to add even more functionality to the program.

New data types

Excel has always been a formidable tool for storing text, numbers, and formulas and allowing users to process information out of them. Still, the data that one could put in Excel grids were limited because they were flat. Recent upgrades improve upon that limitation.

Luckily, users can now add data types to Excel, making the program more dynamic and intelligent. These data types effectively expand what information inside cells can do. In particular, cells can now contain not just text and number data, but a connected, up-to-the-minute collection of information such as currencies, cities, population, stocks, and the like. Simply put, cells can interact with charts and formulas with live data.

Data in cells can be used as a reference for an even larger collection of different data types, images, and actions. In other words, you’re no longer just typing data and writing formulas into a cell, although you can still do both. Rather, a cell can contain a specific set of information that branches out into subsets of data that you would otherwise need to type directly into the cell.

For example, if you’re creating or upgrading a customer information spreadsheet, things like transaction history, preferences, or phone numbers don’t have to be typed one by one. Adding customer-specific data types could simplify this process: entering a customer name in a cell would link to a network of information about a specific entry (i.e., customer) using a scroll-over menu, as opposed to having to enter all that information manually. This makes data input more flexible, efficient, and less prone to error resulting from copy-pasting and manual entry.

Enhancements for Power BI customers

It is, however, users of Microsoft Power BI, the company’s business intelligence program, who will greatly benefit from the upgrades. If your company uses Power BI, data published into your account will automatically link to Excel, which makes the flow of company data types into the program more seamless.

In addition, Microsoft’s data connection technology Power Query will allow users to create custom data types, while pre-configured data types (through a partnership with knowledge engine provider Wolfram Alpha) will also soon be added to let users track different types of information.

This only scratches the surface of what these Excel upgrades can do. For more Office and general productivity tips, consult our IT experts today.

Microsoft and SAS, the privately held enterprise data management and analytics company (and not the airline), today announced a far-reaching partnership that will see Microsoft’s Azure become SAS’s preferred cloud and deep integrations of SAS’s various products into Microsoft’s cloud portfolio, ranging from Azure to Dynamics 365 and PowerBI. The two companies also plan to launch new joint solutions for their customers.

While you may not necessarily be familiar with 44-year-old SAS, the North Carolina-based company counts more than 90 of the top 100 Fortune 1000 companies among its customers, Marquee customers include the likes of Allianz, Discover, Honda, HSBC, Lockheed Martin, Lufthansa and Nestle. While it provides tools and services for companies across a wide range of verticals, they all focus on helping these companies better manage their data and turn it into actionable analytics. Like similar data-centric companies, these days, that includes a lot of work on machine learning, too.

SAS COO and CTO Oliver Schabenberger

“It is a technology partnership,” SAS COO and CTO Oliver Schabenberger told me ahead of today’s announcement. “Our customers are increasingly moving to the cloud. I have something that I call the ‘principles of analytics.’ The first principle is: analytics follows the data — and increasingly, data is moving to the cloud. We have our own cloud operation at SAS. We have done enterprise hosting for over 20 years and have a lot of experience in that. So one of the strategic questions that I asked myself is how do we combine what we love so much about our own cloud and managed services and working directly with a customer with the scale, the agility and the reach of a public cloud?”

The answer to that for SAS was a partnership with Microsoft. Both companies, Schabenberger said, are looking at how to democratize access to technologies like machine learning and analytics, he noted, but are also trying to build data visualization tools and other services that make it easier for anybody within a company to work with the increasingly large data sets that most enterprises now gather.

“The technologies of SAS and Microsoft to me go hand in hand,” said Schabenberger. “They really complement each other. What Microsoft’s doing with Dynamics, with Power Platform, I can envision a new class of business applications — all low-code, no-code — where data and analytics drive logic and drive decisioning. And so for us, what’s really interesting, fascinating and innovative about this relationship is that this is not about bringing a service to Azure, or an integration into Synapse. It is really looking at the entire Microsoft Cloud estate, if you will, from Azure to integrating with AD, with AKS, with [Azure] Database for PostgreSQL. These are obvious things, but then looking at Microsoft 365, Dynamics 365 and Power Platform, how can we be part of this ecosystem? I think that’s a very powerful integration.”

It’s important to note that this is not an exclusive agreement and Schabenberg stressed that SAS will continue to offer support for customers who choose a different public cloud provider.

Scott Guthrie, Microsoft executive VP of its Cloud and AI group, echoed this. “We couldn’t be more excited on the Microsoft side for this partnership. If you look at pretty much any business out there, they’re using SAS for analytics and they’re using Microsoft software as well. And the thing that Oliver called out and what we really look for in strategic partnerships like this is, where can we help our mutual customers do more and achieve more? And I think both from a technology alignment perspective and then also from a mission statement and culture perspective, that’s where we’re so aligned.”

Both Guthrie and Schabenberger stressed how deep the integrations here are. As an example, Guthrie noted that users will be able to take SAS models and embed them into SQL Server statements — and there will be similar integrations for Microsoft products into SAS’s tools, too. Guthrie also noted that the two companies will go to market together in a deep way, too, leveraging the existing salesforces of both companies. “So it’s a little different from what we might do with a startup, which tends to not have a big salesforce. But as part of this partnership, you’ll definitely see our go-to-market deep alignment and Microsoft sellers will be heavily incented to promote and push the SAS integration and likewise, SAS is going to be highly incented to drive this integration from their perspective as well.”

One interesting aspect here is that both companies offer competing products, be that around data management and analytics, as well as data visualization. Guthrie and Schabenberger were quite open about this, though. “I’m perfectly comfortable with that,” said Schabenberger. “I’ve recognized for a long time that our customers have choices and they exercise those choices. And if we bring the right technology to bear and offer it to them, then I’m proud of the technology we built. We’re not the best at everything and I am really looking forward actually to focusing on our core competency, where we’re strongest — and I’m happy to have been customers make other choices. […] We have an existing customer base that wants to make use of their existing investment in SAS technology, but also wants to modernize, wants to be part of a cloud ecosystem, wants to operate with agility and speed and we can combine all that.”

“We’ve been around long enough and we’re big enough and we have enough customers to also realize, you know, what really matters is making your customers successful,” noted Guthrie. “And
the complementary capabilities that we’re bringing together by partnering is so powerful, that yes, there might be some overlap in a few places, but for the most part, this is such a powerful accelerant for our customers and we’re going to both benefit from that.”

People have always been intrigued by what the future holds. Seers use crystal balls and tarot cards, but business managers such as yourself need a tool that’s based purely on science. If you’re an Office 365 subscriber, you now have Power BI’s predictive forecasting at your disposal.

Predictive forecasting uses a variety of statistical techniques, such as modeling and data mining, to analyze current and historical facts to make predictions about the future.
The predictive forecasting function of Office 365 provides users with the skills to generate reports, interactive charts, and 3D visualizations of business performance.

Its built-in predictive forecasting models can automatically detect seasonality in the data, though users can override this by applying a non-seasonal algorithm if they so desire. It also enables users to see how results are affected by adjusting the parameters of the time or confidence interval assigned to be analyzed. Simply put, users can perform advanced forecasting without the complexity that usually accompanies these kinds of processes.

Power BI’s predictive forecasting can also help fill in gaps with data. Power View, an interactive data exploration and presentation tool, fills in missing values from a data set before carrying out a forecast for a more accurate result.

Get started with forecasting by doing following:

  1. Simply upload a workbook with a Power View time series line chart to Power BI for Office 365.
  2. Open the file in Power BI.
  3. Click on the forecast arrow or drag the forecast dot in the line chart and you’ll see forecasting parameters appear in the analysis pane to the right of your report. To get your forecast or projection, configure the parameters:
    1. Forecast Length – This lets you look as far into the future as you wish, be it in days, months, or years.
    2. Confidence Interval – This parameter allows you to indicate the probability of how close predicted values will be to the eventual actual numbers, e.g., you can be 80% certain that actual sales figures next year will be within the range of your forecast.
    3. Ignore Last – Outliers in datasets can distort averages and forecasts. For instance, you want to look into sales for the past 12 months, but you know that the data of every month goes through adjustments before being locked in. With Ignore Last, you can take out data from the most recent month if the numbers haven’t been adjusted yet.
    4. Seasonality – A dataset is said to exhibit seasonality when a pattern can be discerned when looking at values over cycles of time. If you anticipate seasonality in a particular workbook, you can specify if it is monthly, quarterly, or yearly.

Predictive forecasting, if used properly, can immensely help with the overall strategic planning, market penetration, and operation of your business.

Looking to learn more about Office 365 and its features? Call us today for a chat.

The phrase “make your own luck” is thrown around a lot by many successful business people, but what does it actually mean? Part of it means not being a victim of circumstances but rather using these to gain better circumstances over time. To help you prepare for future challenges and opportunities, Office 365 has predictive forecasting: Power BI’s powerful business analytics tool.

Predictive forecasting uses a variety of statistical techniques, such as modeling and data mining, to analyze current and historical facts to make predictions about the future.
The predictive forecasting function of Office 365 provides users with the skills to generate reports, interactive charts, and 3D visualizations of business performance.

Its built-in predictive forecasting models can automatically detect seasonality in the data, though users can override this by applying a non-seasonal algorithm if they so desire. It also enables users to see how results are affected by adjusting the parameters of the time or confidence interval assigned to be analyzed. Simply put, users can perform advanced forecasting without the complexity that usually accompanies these kinds of processes.

Power BI’s predictive forecasting can also help fill in gaps with data. Power View, an interactive data exploration and presentation tool, fills in missing values from a data set before carrying out a forecast for a more accurate result.

Get started with forecasting by doing following:

  1. Simply upload a workbook with a Power View time series line chart to Power BI for Office 365.
  2. Open the file in Power BI.
  3. Click on the forecast arrow or drag the forecast dot in the line chart and you’ll see forecasting parameters appear in the analysis pane to the right of your report. To get your forecast or projection, configure the parameters:
    1. Forecast Length – This lets you look as far into the future as you wish, be it in days, months, or years.
    2. Confidence Interval – This parameter allows you to indicate the probability of how close predicted values will be to the eventual actual numbers, e.g., you can be 80% certain that actual sales figures next year will be within the range of your forecast.
    3. Ignore Last – Outliers in datasets can distort averages and forecasts. For instance, you want to look into sales for the past 12 months, but you know that the data of every month goes through adjustments before being locked in. With Ignore Last, you can take out data from the most recent month if the numbers haven’t been adjusted yet.
    4. Seasonality – A dataset is said to exhibit seasonality when a pattern can be discerned when looking at values over cycles of time. If you anticipate seasonality in a particular workbook, you can specify if it is monthly, quarterly, or yearly.

Predictive forecasting, if used properly, can immensely help with the overall strategic planning, market penetration, and operation of your business.

Looking to learn more about Office 365 and its features? Call us today for a chat.

Wouldn’t it be nice if there was an application with features that can help predict and identify risks and opportunities for your business products or services? Microsoft has turned this concept into reality with Office 365 Power BI’s predictive forecasting. Familiarize yourself with what predictive forecasting is and how it can help your business.
Predictive forecasting uses a variety of statistical techniques, such as modeling and data mining, to analyze current and historical facts to make predictions about the future.
The predictive forecasting function of Office 365 provides users with the skills to generate reports, interactive charts, and 3D visualizations of business performance.

Its built-in predictive forecasting models can automatically detect seasonality in the data, though users can override this by applying a non-seasonal algorithm if they so desire. It also enables users to see how results are affected by adjusting the parameters of the time or confidence interval assigned to be analyzed. Simply put, users can perform advanced forecasting without the complexity that usually accompanies these kinds of processes.

Power BI’s predictive forecasting can also help fill in gaps with data. Power View, an interactive data exploration and presentation tool, fills in missing values from a data set before carrying out a forecast for a more accurate result.

Get started with forecasting by doing following:

  1. Simply upload a workbook with a Power View time series line chart to Power BI for Office 365.
  2. Open the file in Power BI.
  3. Click on the forecast arrow or drag the forecast dot in the line chart and you’ll see forecasting parameters appear in the analysis pane to the right of your report. To get your forecast or projection, configure the parameters:
    1. Forecast Length – This lets you look as far into the future as you wish, be it in days, months, or years.
    2. Confidence Interval – This parameter allows you to indicate the probability of how close predicted values will be to the eventual actual numbers, e.g., you can be 80% certain that actual sales figures next year will be within the range of your forecast.
    3. Ignore Last – Outliers in datasets can distort averages and forecasts. For instance, you want to look into sales for the past 12 months, but you know that the data of every month goes through adjustments before being locked in. With Ignore Last, you can take out data from the most recent month if the numbers haven’t been adjusted yet.
    4. Seasonality – A dataset is said to exhibit seasonality when a pattern can be discerned when looking at values over cycles of time. If you anticipate seasonality in a particular workbook, you can specify if it is monthly, quarterly, or yearly.

Predictive forecasting, if used properly, can immensely help with the overall strategic planning, market penetration, and operation of your business.

Looking to learn more about Office 365 and its features? Call us today for a chat.

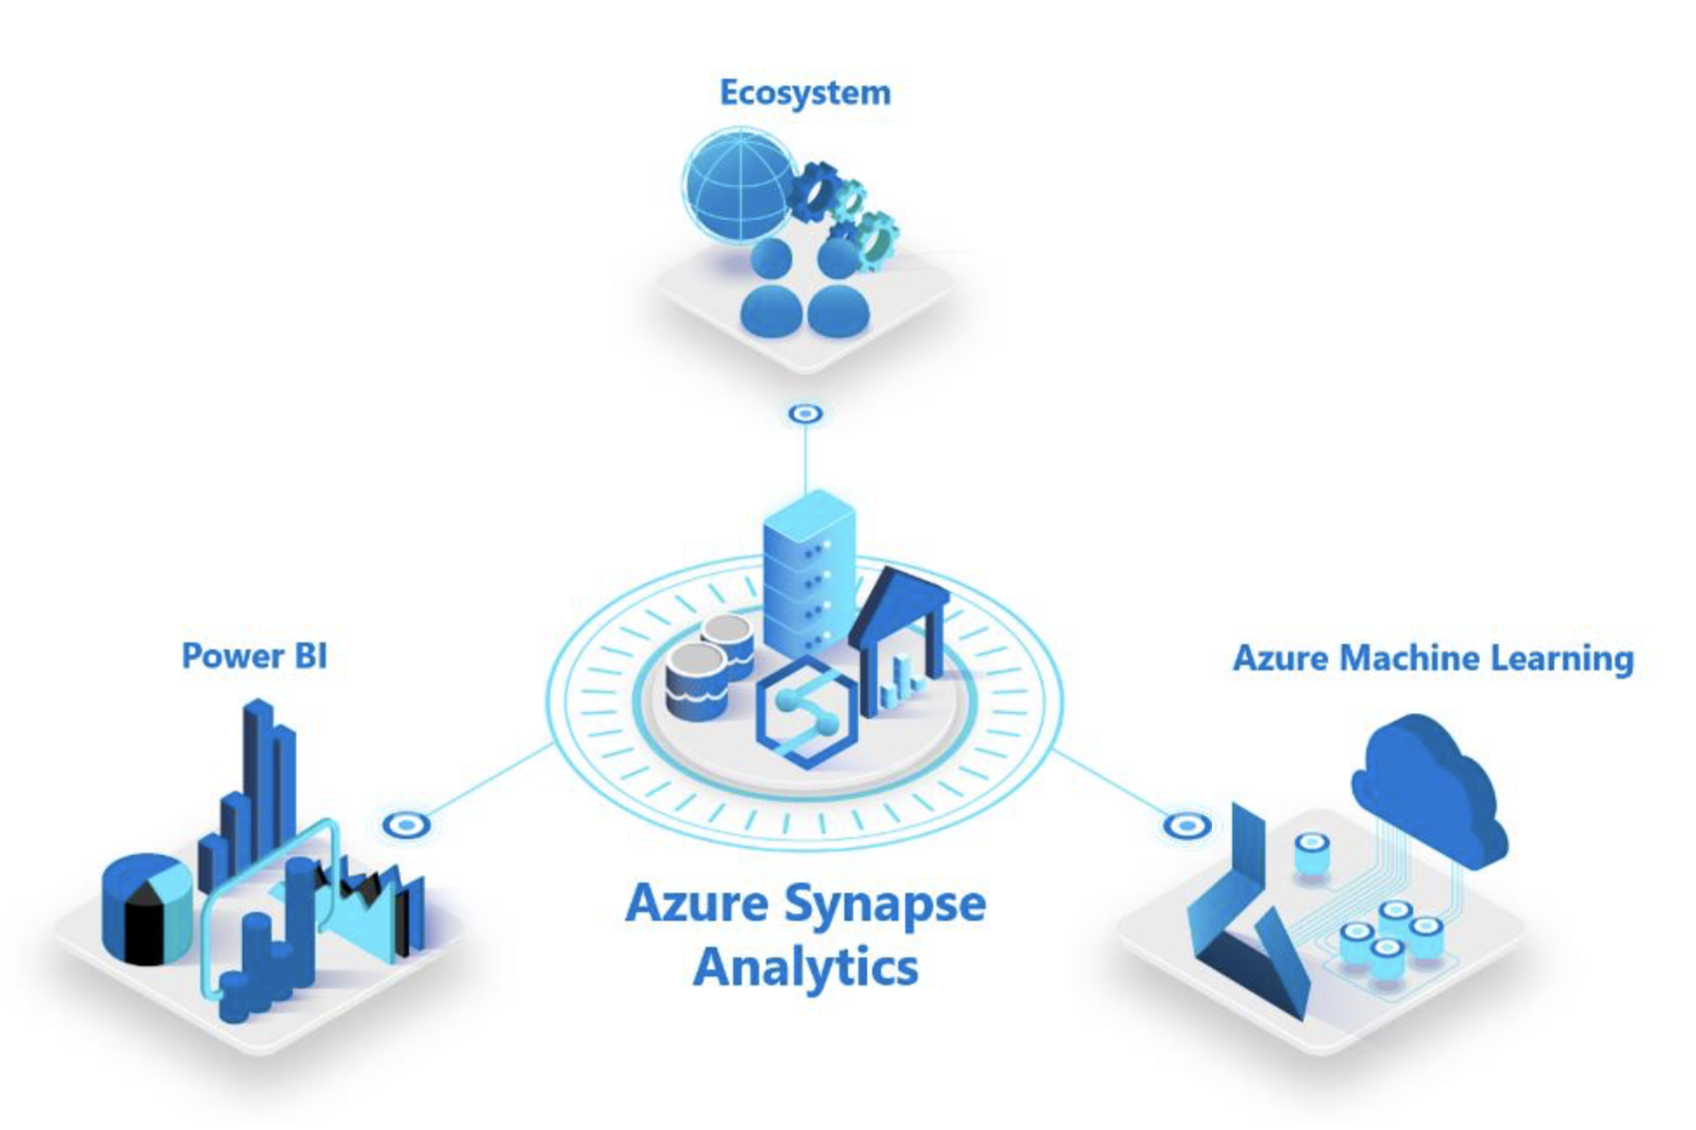
At its annual Ignite conference in Orlando, Florida, Microsoft today announced a major new Azure service for enterprises: Azure Synapse Analytics, which Microsoft describes it as “the next evolution of Azure SQL Data Warehouse.” Like SQL Data Warehouse, it aims to bridge the gap between data warehouses and data lakes, which are often completely separate. Synapse also taps into a wide variety of other Microsoft services, including Power BI and Azure Machine Learning, as well as a partner ecosystem that includes Databricks, Informatica, Accenture, Talend, Attunity, Pragmatic Works, and Adatis. It’s also integrated with Apache Spark.

The idea here is that Synapse allows anybody working with data in those disparate places can manage and analyze it from within a single service. It can be used to analyze relational and unstructured data, using standard SQL.

Screen Shot 2019 10 31 at 10.11.48 AM

Microsoft also highlights Synapse’s integration with Power BI, its easy to use business intelligence and reporting tool, as well as Azure Machine Learning for building models.

With the Azure Synapse studio, the service provides data professionals with a single workspace for prepping and managing their data, as well as for their big data and AI tasks. There’s also a code-free environment for managing data pipelines.

As Microsoft stresses, businesses that want to adopt Synapse can continue to use their existing workloads in production with Synapse and will automatically get all of the benefits of the service. “Businesses can put their data to work much more quickly, productively, and securely, pulling together insights from all data sources, data warehouses, and big data analytics systems,” writes Microsoft CVP of Azure Data, Rohan Kumar.

Low code and no code are the latest industry buzzwords, but if vendors can truly abstract away the complexity of difficult tasks like building machine learning models, it could help mainstream technologies that are currently out of reach of most business users. That’s precisely what Microsoft is aiming to do with its latest Power BI platform announcements today.

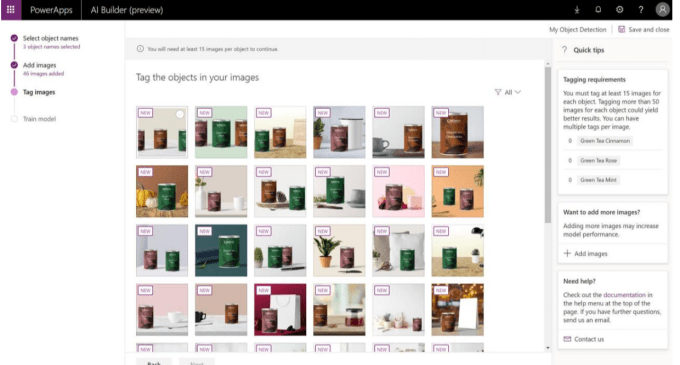
The company tried to bring that low code simplicity to building applications last year when it announced PowerApps. Now it believes by combining PowerApps with Microsoft Flow and its new AI Builder tool, it can allow folks building apps with PowerApps to add a layer of intelligence very quickly.

It starts with having access to data sources, and the Data Connector tool gives users access to over 250 data connectors. That includes Salesforce, Oracle and Adobe, as well as of course Microsoft services like Office 365 and Dynamics 365. Richard Riley, senior director for Power Platform marketing, says this is the foundation for pulling data into AI Builder.

“AI Builder is all about making it just as easy in a low code, no code way to go bring artificial intelligence and machine learning into your Power Apps, into Microsoft Flow, into the Common Data Service, into your data connectors, and so on,” Riley told TechCrunch.

Screenshot: Microsoft

Charles Lamanna, general manager at Microsoft says that Microsoft can do all the analysis and heavy lifting required to build a data model for you, removing a huge barrier to entry for business users. “The basic idea is that you can select any field in the Common Data Service and just say, ‘I want to predict this field.’  Then we’ll actually go look at historical records for that same table or entity to go predict [the results],” he explained. This could be used to predict if a customer will sign up for a credit card, if a customer is likely to churn, or if a loan would be approved, and so forth.

While Microsoft admits this won’t be something everyone uses, they do see a kind of power user who might have been previously unable to approach this level of sophistication on their own, building apps and adding layers of intelligence without a heck of a lot of coding. If it works as advertised it will bring a level of simplicity to tasks that were previously well out of reach of business users without requiring a data scientist.

Getting started with Microsoft Office 365 Power BI

A quick video about Microsoft Office 365 Power BI

Power BI Analytics

A quick example